- Gold one hour trading in a range.
- One hour shows price above 200 Hour SMA
- Price must move and sustain above Daily cloud for a bigger up move to happen. Weakness on price falling back below 200 Hour SMA.
Thứ Bảy, 10 tháng 8, 2013
GOLD Chart update
SILVER Resistance levels
- Silver violates 50 Day SMA after a long gap, Now Silver bulls need a daily close above this level for extending this bounce.
- 4 Hour chart immediate resistance levels for the bounce.
- For a trend change price must trade above the daily cloud.
Thứ Năm, 8 tháng 8, 2013
S&P 500 Analysis after closing bell
- First chart shows bearish price action in daily chart But daily TF is yet to close below 20 Day SMA and the crucial swing low of 1676.
- Immediate support at 20 Day SMA which is at 1688. So initial weakness on closing the day below 1688 levels.
GOLD Trend update
Elliott Wave Update ~ 7 August 2013
Wednesday, August 7, 2013
We have a very decent 5 wave move down from the top. There is an open gap way up high.
Via Sentiment Trader, Rydex leveraged funds at a bullish extreme so quickly again.
Tuesday, August 6, 2013
Tomorrow should be a key day in the outcome of the wave count. Today's down move could be considered a small degree wave iii but we need a lower low to confirm a 5 wave move down and hence a trend change.
The larger backdrop shows a very nice - perhaps completed - 5 Minute waves to the recent peak.
Thứ Năm, 1 tháng 8, 2013
SILVER Chart update
GOLD Support levels
- Gold one hour and 4 Hour charts near crucial support lines.
- Daily chart is testing 50 Day SMA.
- Holding these levels an up move is possible. Daily close below 50 Day SMA may result in a fall.
Elliott Wave Update ~ 31 July 2013, S&P 500 Analysis after closing bell, S&P 500 ~ Elliott Wave Count ~ 31 July 2013
Elliott Wave Update ~ 31 July 2013
You could tell by the overlapping wave structure and the weak internals that the market was trading heavy and "tired". Today may have been an ending diagonal triangle:
Larger picture:
S&P 500 Analysis after closing bell
- Daily indicators are turning weak in S&P 500 chart. Stochastic has given a sell signal. Bears need price to close below 20 Day SMA for a bigger fall to happen.
- Weakness on price trading below 1676 and 1669 levels.
S&P 500 ~ Elliott Wave Count ~ 31 July 2013
![]() |
| (link to previous count) |
Thứ Tư, 31 tháng 7, 2013
SILVER Chart update
- Silver near 50 Day SMA and near channel support line So this price contraction may soon get resolved.
- Channel may get resolved soon for a bigger up move in silver.
- For bulls need a strong breakout above the daily cloud for a bigger up move to follow. Bears need to stay below the channel to extend the current trend.
COPPER Channel and Support levels

- Copper 4 Hour chart shows a channel breakdown.
- Weekly chart shows price near the 2011 lows again.
- Copper bulls need to take support at the weekly levels shown in second chart and do a breakout above the resistance line for a bigger up move to happen.
- Weekly close below the support lines will extend the fall in copper.
Thứ Hai, 29 tháng 7, 2013
Gold ~ 28 July 2013
We got the expected rally to 1350:
As mentioned earlier this month, if 1350ish is convincingly breached, 1180 was most likely a long-term low. A break of 1350 should lead to a rally to 1480/1550.
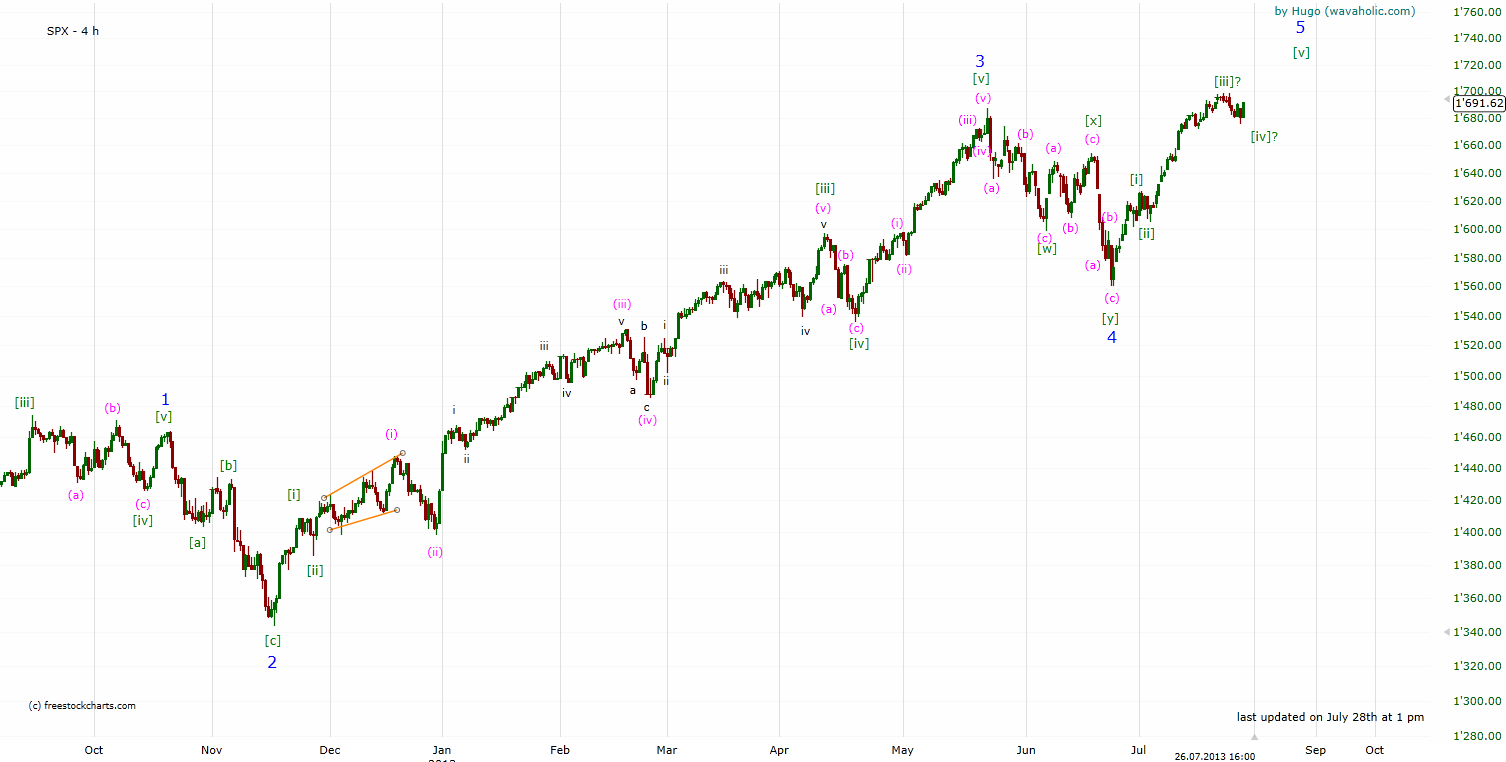
S&P 500 ~ Elliott Wave Count ~ 28 July 2013
It looks like we'll get one more wave higher before a bigger correction.
The current short-term correction might continue for a few more days.
After that, we should see wave [v] to complete wave 5 sometime in
August.
![]() |
| (link to previous count) |
![]() |
| (link to previous count) |
Thứ Bảy, 27 tháng 7, 2013
S&P 500 Weekend update
- Daily chart managed to close above crucial resistance levels.
- Daily line chart with parallel lines or channel shows price near resistance line.
- Daily MACD is moving towards a sell signal. Price falling below 1671 may lead to a fall. Longs possible above 1698 But Risk reward ratio does not look good for bulls at this stage.
GOLD Weekend update
- 4 Hour chart shows the steady ascent of gold above Ichimoku cloud.
- But Daily chart shows price testing the cloud. This has acted as strong resistance level recently.
- Last chart shows price managing to close above 50 Day SMA. So for next week weakness can be seen on daily closing below 50 Day SMA. Price sustaining above 50 SMA may lead to higher levels in gold.
Thứ Năm, 25 tháng 7, 2013
Elliott Wave Update ~ 24 July 2013
Trend Average Challenge
The market came really close to invalidating the 1-2 count I speculated on yesterday by putting a high of 1698.38 but by early morning the market started to sell off confirming some sort of top yesterday by coming down to test the Trend Average as I had been expecting. The main question now is the degree of the top as we could label the move today to 1682 as an ABC or an 1-2-3 with more downside to come tomorrow. For that I am looking at the Trend Average which rose today to 1686 and the market closed just below the TA. The first close below the TA in almost a month so we'll have to see if the market can recapture the TA tomorrow, if it doesn't then it means the correction will continue. Last but not least, keep an eye on the rounded top trendline as any bounce should be held below it for a continued correction.
I am holding VXX which is underwater despite being "right" in buying it at 1690. But I will position trade if the market starts trading above the TA again. This ETN is a tricky trade as sometimes it doesn't correlate well to the market or the VIX for the matter but at the same time it can be very rewarding if one is patient.
S&P 500 Analysis after closing bell
- SPX Daily line chart shows price showing weakness near channel resistance line
- One hour chart shows price breaking the up trend line. More weakness on price trading below the hourly cloud.
- Sustaining above the cloud may resume the up move for one more hit at the channel resistance line before the big correction could start.
Đăng ký:
Bài đăng (Atom)