GOLD Chart analysis - SILVER Inverted Head and Shoulders
- Long term trend of Gold getting tested as price falls into the Monthly cloud.
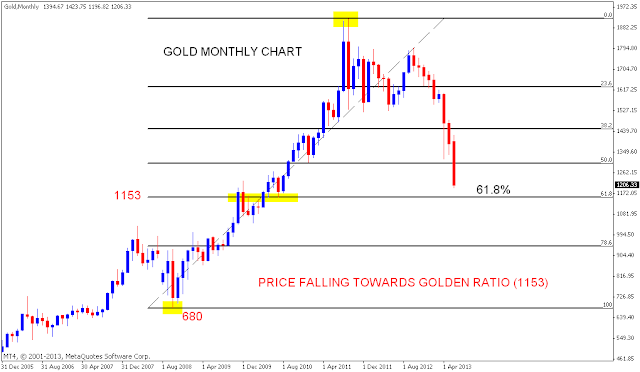
- Price is also nearing Golden ratio in Monthly chart for the rise from 680 to 1920. Golden ratio is at 1153 levels.
- Hour chart continues to trend down below the cloud. For a possible pullback price must trade above the hourly cloud.
SILVER Inverted Head and Shoulders
- Silver 4 hour chart shows an inverted head and shoulders pattern.
- Silver one hour chart shows price above 100 Hour SMA and Hourly cloud.
- Strength on price sustaining above 100 Hour SMA. Bullish pattern will be invalid or weaken on price falling below these levels.


Không có nhận xét nào:
Đăng nhận xét