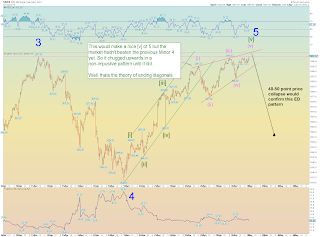
In the below 5 minute Wilshire chart, the top middle of the up channel
would have made a nice wave [v] spot, but that high was not above the
previous Minor 4. So the market may have entered an ending
diagonal triangle in an attempt to get above the previous high and
today's close did just that.
The below 15 minute S&P chart shows the same squiggle count.
To
confirm this count, we can expect a quick 40-50 point SPX drop to below
1460ish for starters due to exhaustive nature of the ending diagonal
triangle.
So that's the call here. Perhaps a quick pop - perhaps hitting 1600 SPX and therefore triggering a secret algo "sell" spot then price collapse based on the potential ED pattern of at least 40-50 SPX points based on the start of the pattern at 1563.


Không có nhận xét nào:
Đăng nhận xét