S&P 500 Futures support levels - 5*
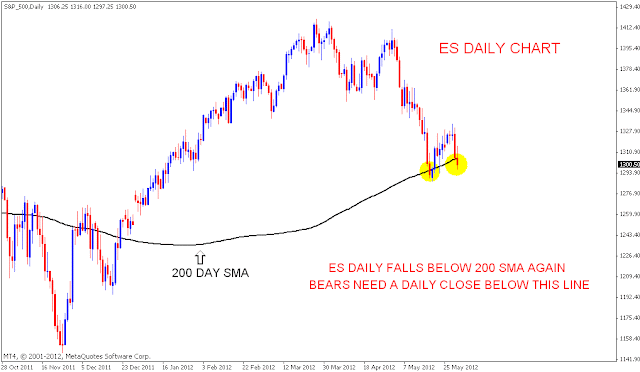
- ES Daily chart shows crucial support at 1287.50.
- Price has fallen below 200 SMA. A daily close below this level will favor bearish trades.
- Monthly candle looks bearish. Bears will be stronger if price starts to trade below 20 Month SMA.
- AUDUSD CHART ANALYSIS
-
- SPX Falling wedge daily chart shows a range between 1291 and 1334
- Price is also stuck between 20 and 200 DAY SMA.
- Four hour chart shows a possible falling wedge pattern which will come into play if 20 Day SMA is taken out on closing basis.


Không có nhận xét nào:
Đăng nhận xét