SP500 update
ES Chart analysis
- Price testing channel support line in four hour time frame. Yet to close below the support line.
- Price seeking support at four hour ichimoku cloud.
- One hour chart shows price trying to hold above 200 Hour SMA. An hourly close below this level may extend gains for bears of ES.
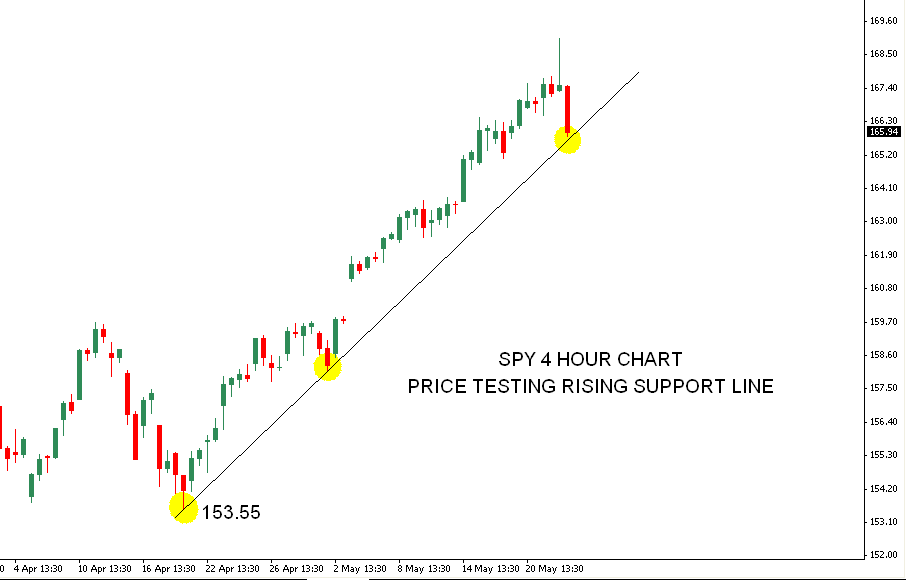
PY Chart analysis
- SPY Four hour chart has given a shooting star pattern.
- Price is testing the rising support line. This one has to break for the shooting star or inverted hammer to perform well.
- Last chart shows price below 50 Hour SMA. Sustaining below this level may extend the fall for bears of SPY.
ES Channel update
- ES Hour chart violating crucial support levels.
- Price must break the channel support line for weakening the up trend.


Không có nhận xét nào:
Đăng nhận xét