Thứ Ba, 31 tháng 7, 2012

Downtrend vẫn tiếp diễn - 4*

Phiên 19/7 tôi đã khuyến nghị mua vào khi HNX 71.3 - 72.9 với kỳ vọng sau khi HNX vượt vùng 72 - 72.5 sẽ chỉ điều chỉnh về tối đa 70.5 và sau đó là tiếp tục đi lên. Tuy nhiên thực tế thị trường đã không diễn ra theo đúng kỳ vọng và phiên 25/7 HNX đã chạm về 69.1 sau đó bật lên. Phiên 26/7, HNX đã bật tăng trở lại 70.2 và tôi có đưa ra nhận xét như sau:

DVC 10:39
kh năng hi không thành công 
DVC 10:42
Thi trưng đang nm trong vùng quá bán nên có kh năng to bulltrap hoc hi khong 1 - 2 phiên
DVC 10:43
xu thế chung vn là xung
DVC 10:43
vì vy tùy thuc vào mc đ chp nhn ri ro ca tng nhà đu tư mà đưa ra quyết đnh có ct l hay không
DVC 10:44
Cá nhân tôi chp nhn ct l ngưng 10 - 12%
DVC 10:44
nếu l quá 12% tôi s không bán


Với kết quả phiên 27/7, HNX đóng cửa tại 69.35, tôi có một số Update như sau:


Xu thế dài hạn:

  • HNX vẫn chưa vượt được 78.5 nên tôi vẫn giữ quan điểm về thị trường từ 5/2012 đến hết năm nay vẫn là downtrend như dự báo của tôi từ 10/1: 5 tháng đầu năm Uptrend, 6 tháng tiếp theo là downtrend.
  • Bài viết 10/1/2012 là cốt lõi của tất cả các nhận định, dự báo của tôi trong cả 2012. Quan điểm này sẽ bị sai khi HNX vượt qua được 78.5
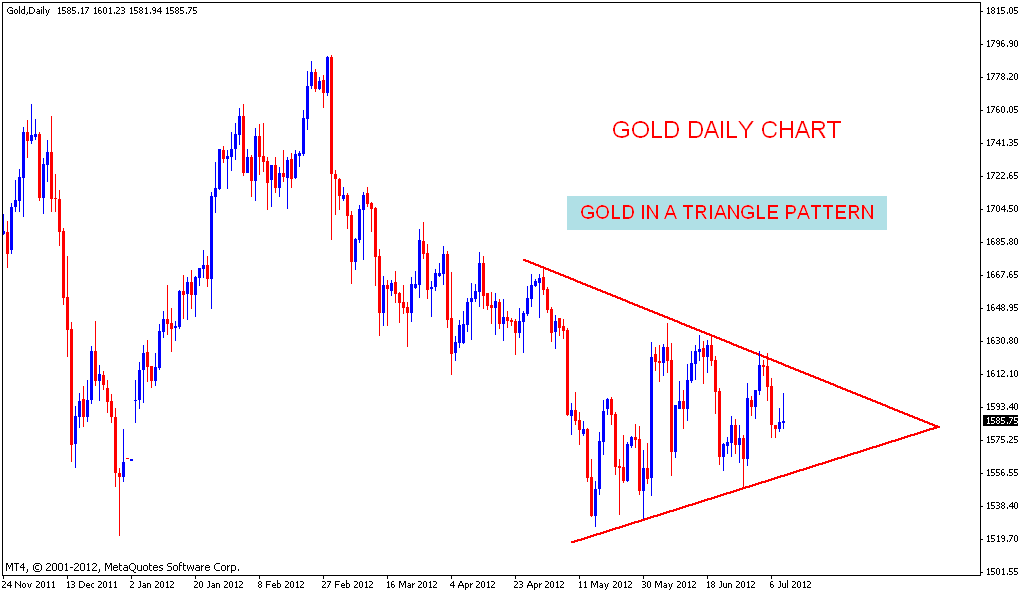
  • Các yếu tố cơ bản hỗ trợ cho kịch bản này tôi đã trình bầy cụ thể tại bài viết 10/1/2012 và bài viết 12/7/2012

Xu thế trung hạn:

  • HNX đã vượt được 72 - 72.5 vào 19/7 nên tôi kỳ vọng vào 1 xu thế trung hạn đủ an toàn để trading tuy nhiên đây là bẫy kỹ thuật mà tôi đã mắc phải;
  • Sẽ xác nhận downtrend trung hạn nếu HNX thủng 67.8;
  • Nhiều khả năng đợt tăng từ 10/7 đến 20/7 chỉ là 1 sóng hồi của 1 downtrend trung hạn

Xu thế ngắn hạn:

  • Một số chỉ báo ngắn hạn đang ở vùng oversold nên nhiều khả năng thị trường sẽ xuất hiện bulltrap 0.5 - 1 phiên
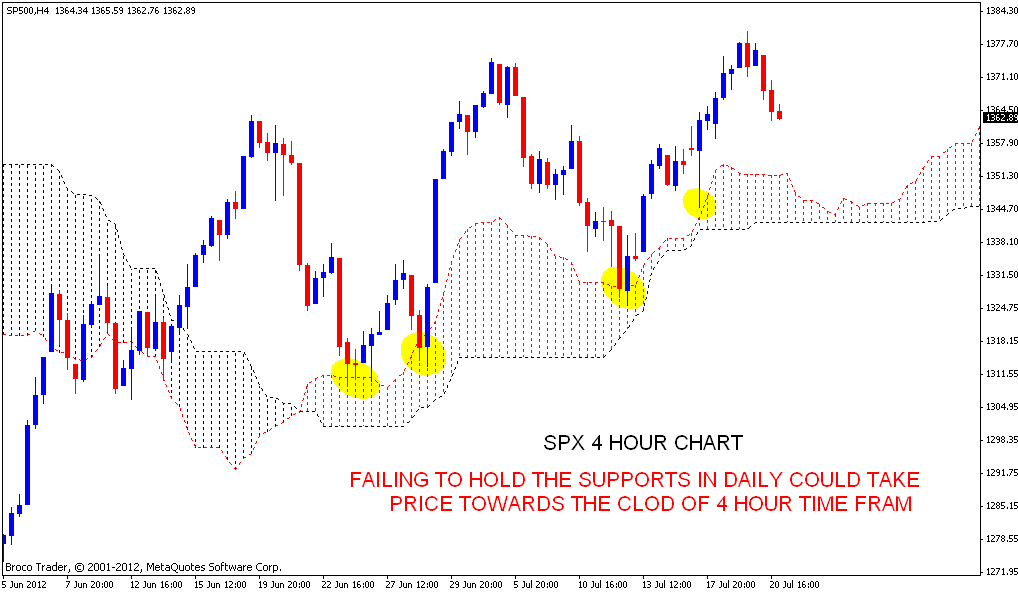
  • Tuy nhiên một số chỉ báo trong trung và ngắn hạn đang trở nên tiêu cực hơn rất nhiều sau  phiên 27/7 vì vậy tôi đánh giá xu thế trong vòng 5 phiên tới xuống

Với các yếu tố cơ bản tôi đã đưa ra trong bài viết  10/1/2012 và bài viết 12/7/2012 và cách tiếp cận sóng Elliot mà tôi đã đưa ra từ 10/1/2012, tôi đưa ra kịch bản dự báo từ nay đến hết năm như sau.


Chú ý là kịch bản này chỉ mang tính chất tham khảo do dựa trên lý thuyết sóng Elliot trung và dài hạn. Kịch bản này sẽ được thay đổi nếu các bước sóng ngắn hạn bị thay đổi

Chi tiết cách đếm sóng Elliot dài hạn của tôi từ 3/2007 đến cuối năm nay như chart dưới đây


Dương Văn Chung

Elliott Wave Update ~ 30 July 2012 - 3*

Monday, July 30, 2012


Elliott Wave Update ~ 30 July 2012

Kind of expected the way the day played out. A new burst to a higher high then some (seemingly) consolidation.

Top two squiggle counts:
Or Minor 2 could be over:
Daily:
A lot of non-confirmations going on at the moment:
Using the Wilshire 5000 for the overall count:

ES Chart update

  • ES 4 hour chart Trying to stay above previous resistance levels which are acting as support.
  • One hour chart shows a range which has to be broken for further moves to happen.
  • Price sustaining above 50 Hour SMA and cloud may lead to an upper breakout.

S&P 500 Futures chart update

  • ES One hour chart sustaining above 50 Hour SMA and hourly cloud should favor bulls for a bullish consolidation breakout.
  • ES Daily chart shows crucial resistance at 78.6% Fib level which should be crossed for extending the current up move.


SPX update

Tuesday, July 31, 2012

Since June SPX is under a complex pattern...My primary count suggests a triple zig zag but I'm not sure if is correct. Let's see what "they" do!

SPX UPDATE

Thursday, July 26, 2012

Monday, July 30, 2012

One more push to 1400?


The market barely made another higher high but it was within the 1388-1392 range I mentioned couple of weeks ago and it looks like a W4 set up for a final W5 push to 1400+. The FOMC meeting will likely be the excuse for a rally, so I would expect a rally to start in the next session or two before profit taking starts taking place sending the market to test the Trend Average. And if that TA holds, then it just opens the possibility of a strong bullish wave that will mark a new high for the year. The bearish case only has a chance if it manages to send the market below the TA and the 50 day ma, until then the way is up. So if you like shorting, at least do it below the TA and not when the market is galloping.. you'll sleep a lot better.

Long Term Portfolio: 100% Long
Short Term Trading Strategy: Shorting intraday extremes, closing same day

Chủ Nhật, 29 tháng 7, 2012

Elliott Wave Update ~ 27 July 2012

Elliott Wave Update ~ 27 July 2012

The market has spoken. Minor 2 is still on and the ascending triangle turned out to be correct. Congrats bulls. Even the 1390 mark that a lot of people have chattered about was about touched.
Measured move target for Wilshire 5000:

Slight negative divergence on the NYAD line:
SPX daily:
NASDAQ 100 (and composite) has not yet confirmed the move of the DJIA and S&P500.
GDOW at a mere 38% retrace of the March high.
Transports have not confirmed either:

Friday, July 27, 2012

S&P 500 ~ EOD Update ~ 27 July 2012

Another huge rally today. We're back at the upper trendline and near my target at 1390ish.


If the market continues its behavior of the last few weeks, we should form a top around this level and then decline back to the lower trendline again. But we'll see what happens next week.

Have a very nice weekend!  

Thứ Bảy, 21 tháng 7, 2012

Elliott Wave Update ~ 20 July 2012

Friday, July 20, 2012

Elliott Wave Update ~ 20 July 2012

A break of 1357 would likely confirm that Minor 2's double zigzag pattern is complete. This is where wave i of (c) price peak resides.

S&P 500 Support levels

 
  • Daily chart shows 100 Day SMA and Golden ratio near 1358 - 1359 level.
  • Price holding on to the above support levels may save bulls from a bigger fall and an up move towards 1390 levels is also possible.
  • Price breaking the above mentioned levels can take SPX towards the cloud of Four hour chart which has managed to stop the falls till now. For bears a bigger fall is possible if the cloud breaks.

Friday, July 20, 2012

4 Waves


The market finally corrected today and now we have 4 clear waves on the chart. So we could (and should) see a 5th wave materialize early next week to complete this wave from the 1325 low. One thing to keep in mind is that w1 was 32.5 points and w3 was 35 points. So a 5th wave would have to be more than 32.5 points going by wave theory. If we add 32.5 points to the low for the day (potentially the low for w4) then we get at least 1395, so early next week should be fun if the 5 wave move completes. Now, there have been recent 5th wave failures so anything can happen next week, but this is all about odds.


Long Term Portfolio: 100% Long
Short Term Trading Strategy: Shorting intraday extremes, closing same day

Have a great weekend!

Thứ Ba, 17 tháng 7, 2012

Elliott Wave Update ~ 16 July 2012

Monday, July 16, 2012

Elliott Wave Update ~ 16 July 2012

The 30 minute SPX chart shows the best count possibilties. Either Minor 2 ended at 1374.81 or the market will trace a double zigzag which would take prices higher toward the 1390 level.

There is room however a modest push toward forming a wave (ii) of minute [i] of Minor 3 down which takes prices higher than Friday's 1357.7 yet keep them beneath the 1374.7 Minor 2 peak is one we need to watch.

The double zigzag scenario will require that the market expend a lot of effort to get above the previous 1374 mark. The SPX daily below shows the resistance that the market would have to deal with in getting above that price and holding it as support.  Its a tough nut to crack and one would expect that Minor 2 will have trouble doing so. After all, Minor 2 is perfectly expected to die in this resistance area or else it wouldn't be Minor 2.

A close under 1335 SPX would strongly put price action back in the bears' hands.
The NYAD count would count better with another new cumulative high. That supports one more push up in either forming a wave (ii) of [i] of 3 peak (between 1357 and 1374)) or else a new Minor 2 high itself (likely 1390ish).  So it should be interesting to see how prices play out over the next few days to a week.

S&P 500 Analysis after closing bell


  • First chart shows trend lines and support lines which must be taken out for a bigger move to happen.
  • Second chart shows the range 1325 - 1374 which must be broken for a bigger move.
  • Last chart shows rising support levels with the up move of 200 Day SMA. For bears closing belwo 200 SMA will result in a bigger correction.

Chủ Nhật, 15 tháng 7, 2012

S&P 500 Weekend update


  • Daily chart shows price moving up and RSI moving in a sideways channel which should favor bears But price sustaining above 50 Day SMA is giving support to bulls. Price on closing above 100 Day SMA should strengthen bulls further.
  • Immediate resistance levels are the Golden ratio and 1370 - 1374 zone. 
  • Weekly chart shows price testing 20 Week SMA and MACD ready for a buy signal But Price sustaining below 20 Week SMA Should keep the MACD sell signal intact for a correction. 
  • FALLING WEDGE OF EURUSD

Elliott Wave Update ~ 13 July 2012


Friday, July 13, 2012


Elliott Wave Update ~ 13 July 2012

Minuette (ii) is the primary count. The altnerate  is a Minor 2 double zigzag which will carry prices higher than 1374 SPX.
Although a vigorous rally developed today, prices are only just coming up to major resistance again.
NYAD count. New NYAD cumulative high is the projection. Whether or not that results in a new Minor 2 high or something else we'll just have to see.


Friday, July 13, 2012


S&P 500 ~ Intraday Update ~ 13 July 2012

As mentioned in my last post, a break of 1335ish should lead to higher prices.


S&P 500 ~ Intraday Update ~ 13 July 2012

S&P 500 ~ Intraday Update ~ 13 July 2012

As mentioned in my last post, a break of 1335ish should lead to higher prices.


Thứ Tư, 11 tháng 7, 2012

GOLD Triangle pattern


  • Gold daily chart in a contracting triangle pattern.
  • For confirming an upper breakout price should trade above 100 Day SMA and the resistance line.
  • Downside may be limited because of the strong weekly support levels near 1520 levels