Tuesday, July 3, 2012
Elliott Wave Update ~ 3 July 2012
The SPX closed solidly above resistance. The next - and last resistance prior to the previous 1422 SPX high - is probably in the 1389-1392 range.NYMO is overbought.
GDOW.
Updated NYAD Count. It looks better actually than before.
S&P 500 Analysis after closing bell
- Price moving away from 100 Day SMA.
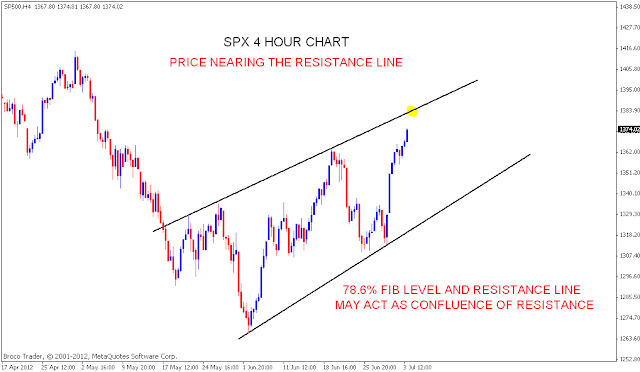
- Next possible resistance is the resistance line shown in last chart and the 78.6% Fib level shown in 2nd chart.
- For bears, price closing above the 78.6% will be bad news as it gives chance for a bigger rally and a possible breakout above weekly high's. Getting resisted at these levels should result in a swing down, For a larger correction the channel of four hour chart has to breakdown.
- DESCENDING BROADENING WEDGE OF QQQ
S&P 500 ~ Intraday Update ~ 3 July 2012
No double top at 1366 - the rally continues today. A few minutes ago,
the SPX hit the next resistance at 1375. The markets will close in about
an hour so this is most likely as high as we go today.


Không có nhận xét nào:
Đăng nhận xét