

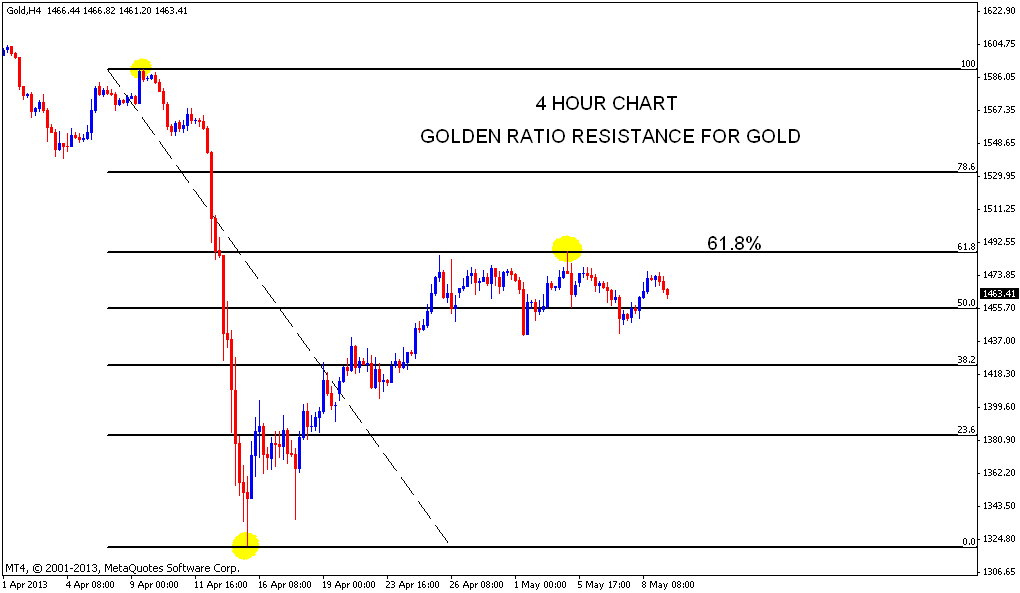
- Gold four hour chart shows price in a range. Its a 47 point range in four hour time frame.
- Price is getting resisted at Golden ratio shown in four hour time frame.
- Weekly chart shows crucial support at 200 Week SMA.
SILVER Triangle pattern


WEEKLY CHART

- Silver 4 Hour chart in a triangle pattern. Price closing outside this pattern may result in a bigger move.
- Fib levels of 4 Hour chart shows price stuck in a range between 23.6% and 38.2% Fib level which has to resolve for an extended move to happen.
- Last chart the weekly time frame shows the broken level of 26 as resistance. Any up move from here will find it tough to cross the previous support level of 26.
- Crude oil daily chart pausing at resistance line.
- Even if a breakout happens the upper targets looks limited as weekly chart is nearing Golden ratio.
CRUDE Oil resistance levels


Không có nhận xét nào:
Đăng nhận xét