In the past we had singled out a specific country’s stock market and offered an analysis. Unfortunately, that was not possible to continue since we cover nearly twenty foreign markets. The probable wave patterns of each of these foreign indices are posted on pages 5 to 8 on the public charts: http://stockcharts.com/public/1269446/tenpp/5. We group these countries into three categories: Asia, Europe and Commodity, and report on them daily and every weekend. The countries covered are: Australia, Brazil, Canada, China, England, France, Germany, Greece, Hong Kong, India, Indonesia, Italy, Japan, Russia, Singapore, S. Korea, Spain, Switzerland. We also cover the DJ World index and the european STOX 50.
We had not reported on these stock markets, in detail, since 2011. Since markets, in general, were giving mixed signals during 2011 and 2012. Now that things have cleared up we decided to do a complete review of all the world’s markets we track. The results were quite interesting. In general, while the US has remained in a quantified bull market since 2009 this can not be said of any of the foreign indices we track. Certainly foreign markets have been rising, and some have even made all time new highs. But quantitatively, they are all on different wave patterns than the SPX/DOW.
To arrive at this conclusion we first divided all the world’s indices, we track, into four categories: 1. those that continued to rise from 2009, 2. those that continued to fall from 2007, 3. those that had three wave rallies into 2010/11, and 4. those that had five wave rallies into 2010/11. The first two were easy to decipher since there was only one index in each category: the US in category 1, and Greece in category 2. The US ended its 2007-2009 Super cycle 2, and has been in a Cycle [1] bull market since 2009. Greece ended its 1999-2012 Super cycle 2 bear market, and started a new Cycle [1] bull market in 2012. We actually identified that mid-2012 low without much fanfare on the public blog. The details of the bull market can be found in the public charts. Categories 3 and 4 took lot more work to decipher.

In category 3 we found: Australia, Brazil, China, England, France, Italy, Japan, Russia, Singapore, Spain and the STOX 50.
Japan has been in a Super cycle bear market since 1989. Despite the recent surge, due to QE and currency devaluation, we still believe this bear market has not concluded.

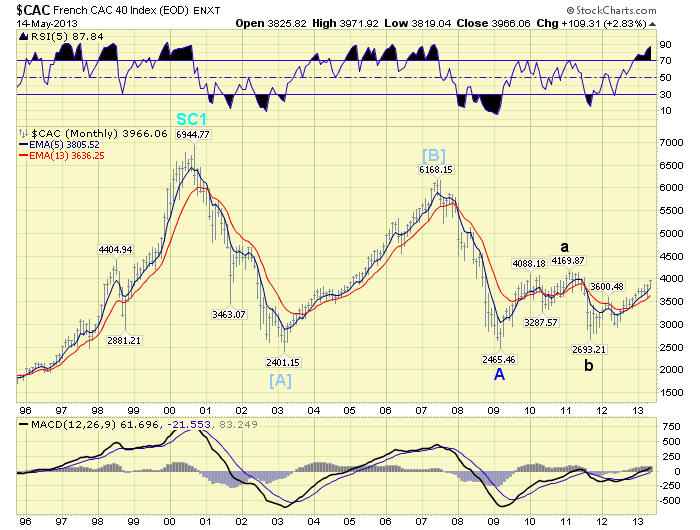
England, France, Italy and the STOX 50 have been in a Super cycle bear market since 2000. These four indices are following the Secular deflationary cycle. France and the STOX 50 look the same long term: a Cycle [A] low in 2003, a Cycle [B] high in 2007, then a Primary A low in 2009, and now an abc Primary B advance underway. Both indices will lose all of the gains since 2009 during the next bear market.
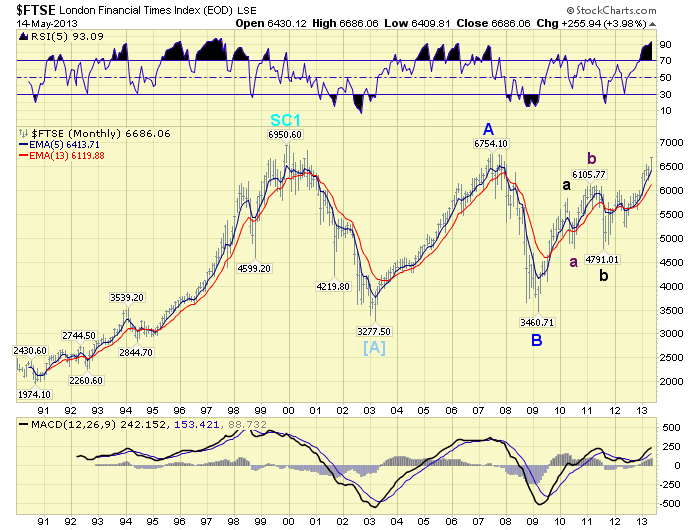
England is a bit different. A Cycle [A] low in 2003, a Primary A high in 2007, a Primary B low in 2009, and now a Primary C advance underway. It too should lose all of its gains, since 2009, during the next bear market.
Italy is a bit different still. A Cycle [A] low in 2002, a Cycle [B] in 2007, and now there appears to be a diagonal triangle Cycle [C] underway. Italy is much closer to a Super cycle bear market low than the three indices noted above.

Australia and Singapore look quite similar. A Super cycle high in 2007, followed by a Cycle [A] low into 2009, a Primary A into 2010/2011, Primary B low in 2011, and now a Primary C underway. During the next bear market both indices should lose all of their gains from 2009.

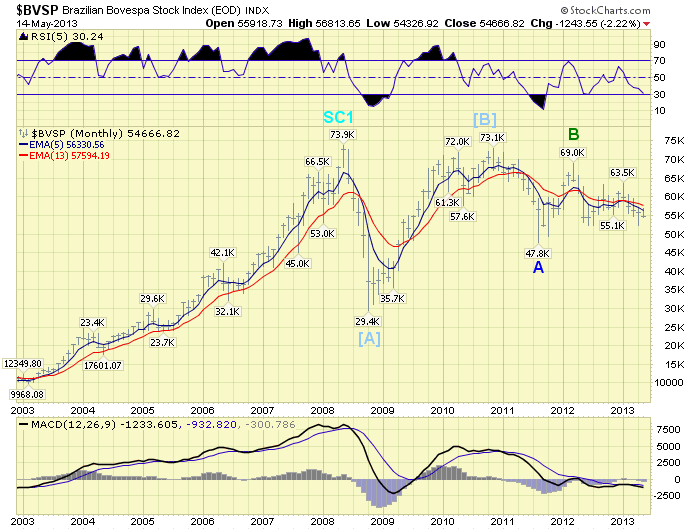
Brazil and Russia look similar. A Super cycle top in 2008, followed by a Cycle [A] into 2008, then a Cycle [B] into 2011, and now a Cycle wave [C] underway. It is quite unlikely either index will see the 2011 highs before they fully retrace the advance from 2008.
Spain appears to be in a Cycle [1] bull market since mid-2012 like Greece. Details on the public blog charts.

China, another of the BRICs, has a totally different pattern. A Primary I top in 2001, a 4-year Primary II until 2005, a strong Primary III into 2007, now a 5-year triangular Primary wave IV. We believe the C wave of the triangle completed in late-2012, and the D wave, possibly back to 3,000 is underway. When the D wave completes, a downward E wave will follow to a higher low than waves A and C to complete Primary IV. Then China should be on its way to all time new highs.

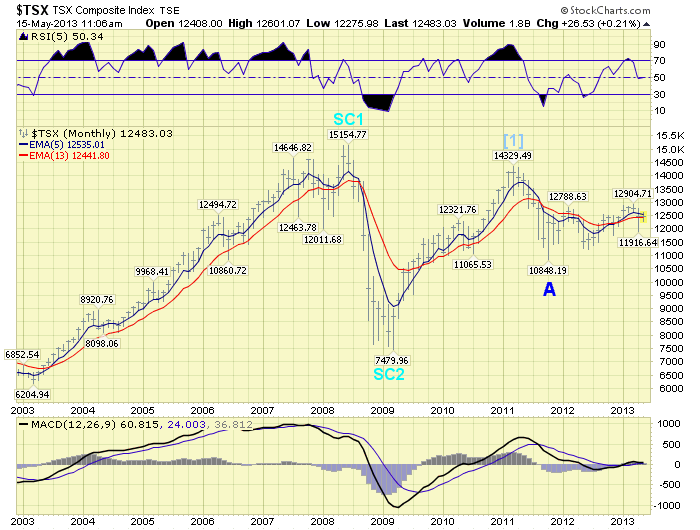
In category 4 we found: Canada, DJ World, Germany, Hong Kong, India, Indonesia, S. Korea, and Switzerland. Canada, DJ World, Hong Kong and Indonesia all look similar. A Super cycle top in 2007, then a Super cycle low in 2009. This is followed by a short Cycle wave [1] bull market into 2011. Then a Cycle [2] bear market begins with a Primary A down into 2011, currently a Primary B wave up, which will be followed by a Primary C down to complete the Cycle [2] bear market. None, of these indices, like the SPX/DOW, will see the 2009 lows again.
India is a but different long term. The Nifty made a Super cycle low in 2001. The 2008 peak was the end of Cycle wave [1], and the 2008 low Cycle wave [2]. Quite short in time, historically. The five wave advance from that low to 2010 was Primary I, of Cycle [3]. Next we have a selloff into 2011. This is counted as a Primary II, with Primary III underway from that low. We are also carrying an alternate count, listed on the BSE chart. This alternate count, posted below, suggests the 2011 was the end of Major A of Primary II. And the current advance is Major B. Under this scenario the BSE should drop below the 2011 low during the next bear market.

Germany is very similar to the alternate count on India. The only difference is that it completed its Super cycle 2 bear market low in 2003.

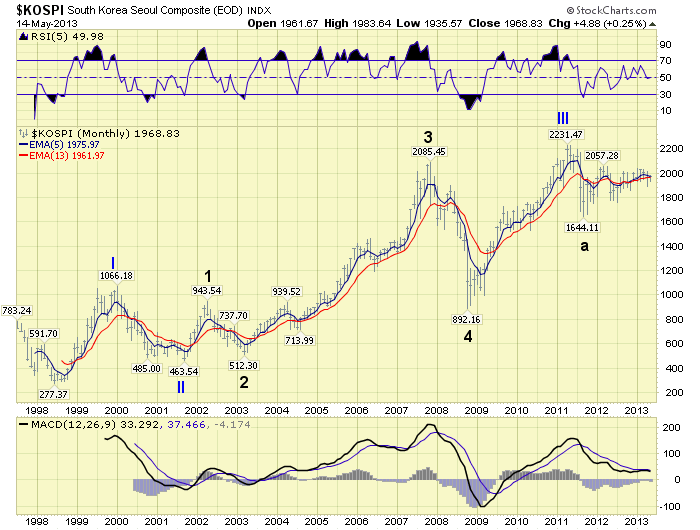
Next we have S. Korea. This is a very interesting long term chart. Notice it is currently in a Primary IV bear market. Having completed Primary III in 2011, and Primary’s I and II way back in 2000 and 2001. S. Korea may be forming a Primary IV triangle, then a spike higher to complete Primary V. If not, the 2008 lows may be revisited during the next worldwide bear market.
Last, but not least, is Switzerland. An even more interesting pattern going back to 1991. Notice the five waves up into a 2000 Primary III peak, then the Primary IV bear market into 2003. After that a Primary V, to complete SC 1, in 2007. This is almost identical to the SPX/DOW. But the similarity ends there. The selloff into 2009 we have labeled as Cycle wave [A]. Since then the SMI has rallied in a Primary A, down in a Primary B, and now rising in a Primary C. When this bear market rally concludes we expect the SMI to retest the lows in 2009.

There, you have it. A total review of all the foreign indices we track in one concise report. Hope this will help some of you in the months and years ahead.
Không có nhận xét nào:
Đăng nhận xét