Elliott Wave Update ~ 12 June 2013


ES Chart update


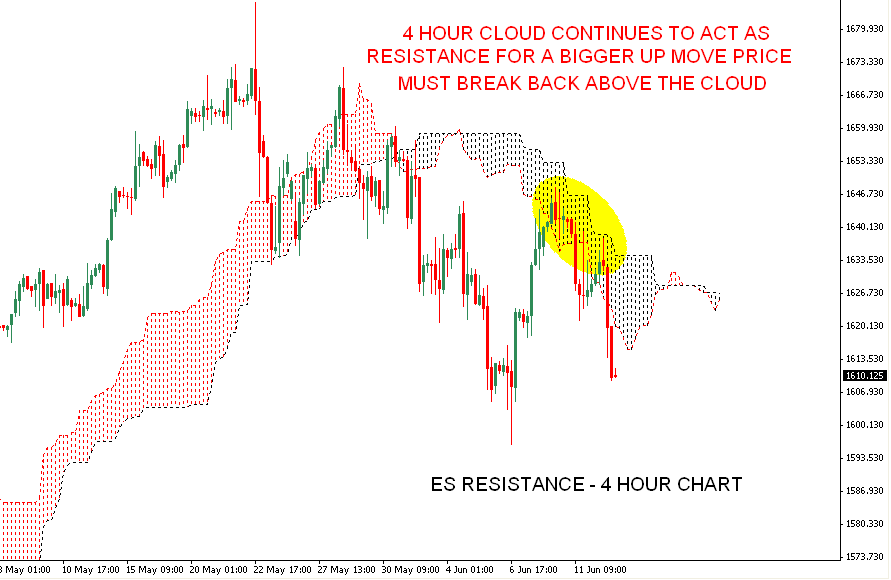
- ES Falling down in a channel as shown in four hour time frame.
- Daily is testing 50 Day SMA.
- 4 hour chart shows resistance at the cloud. For a bigger pullback price must break back above the cloud.
S&P 500 ~ EOD ~ 12 June 2013

As mentioned earlier, I think we could see 1600ish soon.
Make or Break Time


Futures were up 10 points last night when I went to bed but to my surprise the market was near the days low by the time I woke up. The market lost key support at 1623 and 1614 which took a while for the bears to break. However, the bullish count is still very much alive and so is the IHS I have been tracking but time is running out so bulls need to step in force starting tomorrow. One thing I forgot to mention yesterday was the 50 day moving avg, where the market found its bottom today. Every single time the market has tested the 50 day ma this year, the market has managed to mount a strong rally within a day. In addition, the NYMO is now again in a territory where the market usually finds a base to rally. So while the market is getting close to retracing most of its gains from 1598 and invalidating the bullish pattern, these last few points (to put in a lower low) might be a challenge to the bearish side. The Trend Average has turned solidly red again and that is a flag to anyone holding long positions (like me), also futures are not looking too good as I write this so we'll see. My plan is to evaluate how the market rallies to the Trend Average on the next bullish wave and evaluate my positions at that time.
Main S&P 500 Trends
Short Term Trend = Bearish
Medium Term Trend = Bullish
Long Term Trend = Bullish

Không có nhận xét nào:
Đăng nhận xét